
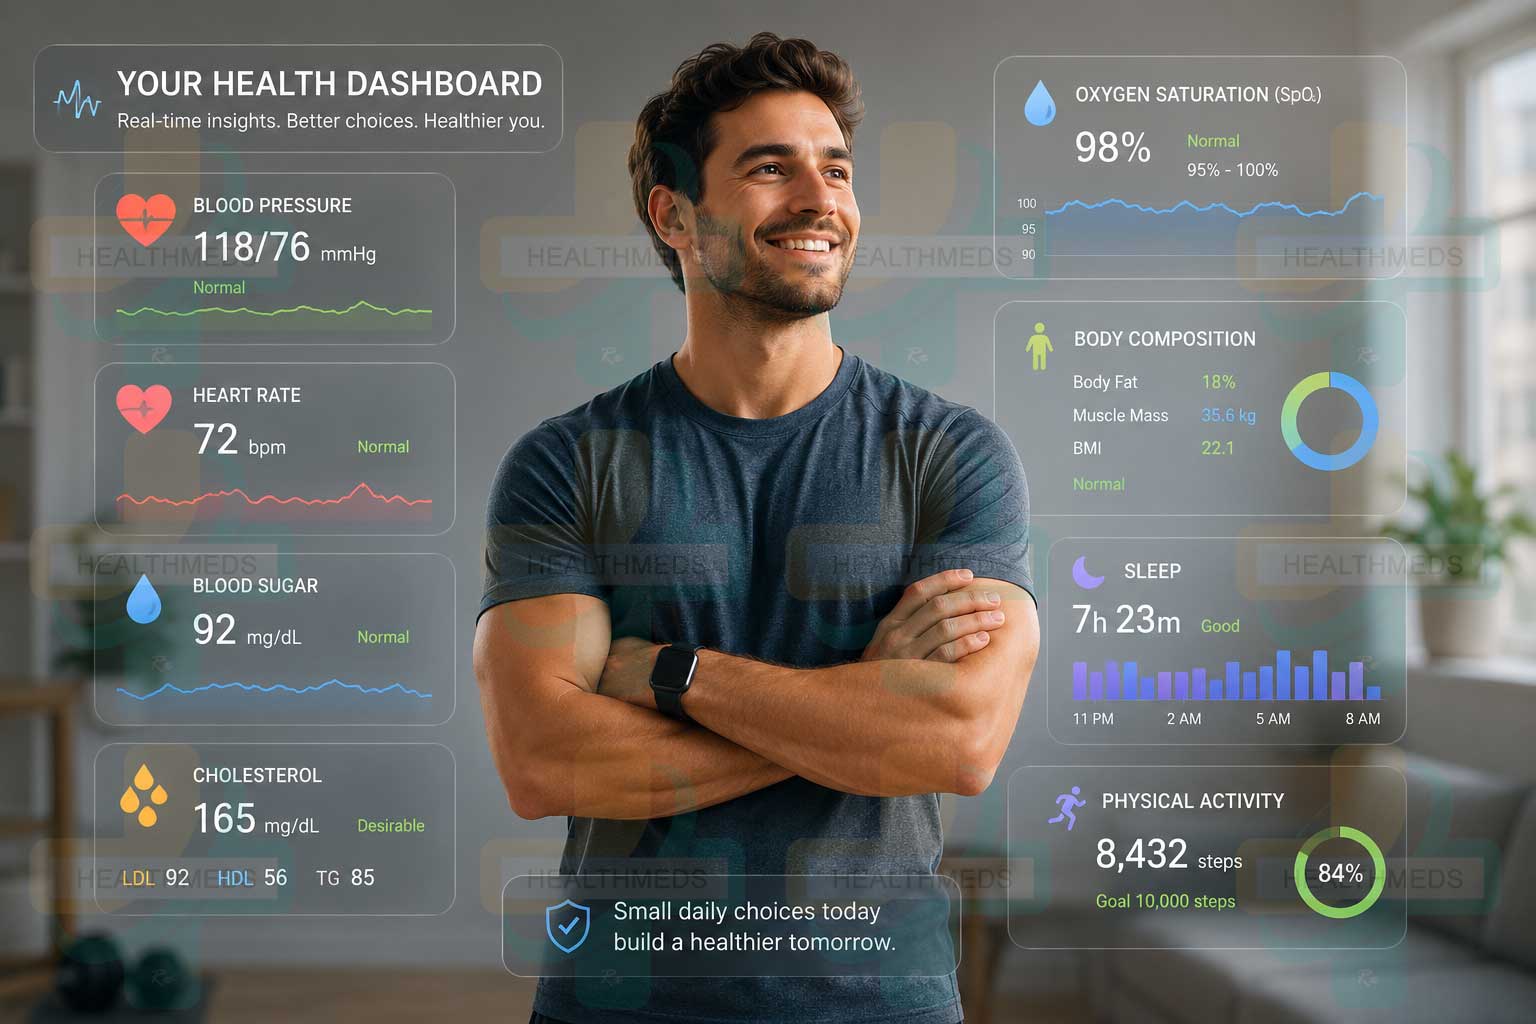

Healthcare professionals look beyond how you feel. They rely on health metrics, measurable indicators that reveal how well your body is functioning on the inside.
“I feel healthy.”
It’s a phrase we say confidently, often because we don’t feel sick, can get through the day without much trouble, or manage to fit in a few workouts each week. While those are all encouraging signs, they don’t always tell the full story.
Think about taking your car for a routine service. A mechanic doesn’t simply ask, “Does it seem to be running okay?” They inspect the oil level, tire pressure, engine temperature, battery health, and brake performance.
Each measurement provides valuable information, and together they paint a complete picture of the vehicle’s condition.
Your body works in much the same way.
Your heart, lungs, metabolism, muscles, and other systems constantly leave measurable clues about your health. These clues are called health metrics, and understanding them can help you make informed lifestyle choices, identify potential problems earlier, and maintain your overall well-being.
The goal isn’t to memorize every medical number or obsess over your smartwatch. It’s to understand what these measurements mean, why they matter, and how your daily habits influence them.
What Exactly Are Health Metrics?
Health metrics are objective measurements of various aspects of your health. While symptoms represent what you feel, health metrics provide quantifiable values for health professionals to analyze.
Here is the difference between:
- Feeling tired is a symptom.
- Having blood pressure measuring 150/95 mmHg is a health metric.
While one statement describes that something is not right with you based on how you feel, the second one explains what the actual cause of that discomfort is.
This issue plays a significant role because many diseases develop without showing any symptoms. For instance, high blood pressure, high cholesterol, or high blood sugar do not have easily noticeable symptoms in their early stages.
In other words, health metrics can answer a very important question:
“How is my body functioning, even when I feel perfectly fine?”
Why Healthcare Professionals Don’t Judge Your Health by Just One Number?
A lot of individuals worry about one single quantitative value, such as body weight or the Body Mass Index (BMI), to know if they are fit.
However, the reality is much more complicated.
Let’s take a simple example of two adults:
- One has a perfect body weight but does not exercise, sleeps only 5 hours at night and has high blood pressure.
- The other person is slightly overweight but is active and exercises regularly, has healthy cholesterol, normal blood sugar, and an excellent level of cardiovascular fitness.
Who is healthier?
It is difficult to find out without enough information, based on only one measurement.
What health providers look for is not just one health metric value, but a combination of metrics, each of which is important, which provides a bigger picture about health as a whole.
Since those readings are pieces of the health puzzle, only by combining them can the right information be received.
The Health Metrics Every Adult Should Understand
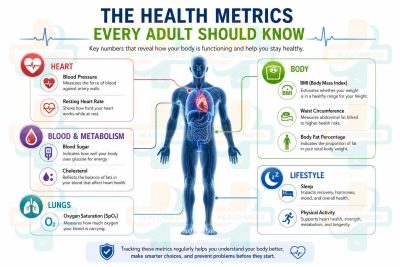 One does not need a medical qualification to make an impact with these primary health metrics. You can explore their meanings and measurement significance when taking action to improve your health.
Blood Pressure: The Force Behind Every Heartbeat
Blood pressure numerically expresses the pressure of blood against the arterial walls when the heart is beating.
Blood pressure is measured using two values:
- Systolic blood pressure (the upper value): blood pressure while the heart contracts and pumps blood out.
- Diastolic blood pressure (the bottom number): the pressure of the blood when the heart muscles relax in between the heartbeats.
A healthy blood pressure is generally considered below 120/80 mmHg for most adults.
To get an idea of how it works, consider your plumbing system. If you have low water pressure in your house, water can’t be delivered automatically. If the water pressure is too high for an extended period, the pipes are under constant pressure. Arteries work in the same way.
High blood pressure often develops without any apparent symptoms, which is why it is often called the “silent killer.” Regular blood pressure check-ups help track changes.
| Category | Blood Pressure (mmHg) |
| Normal (Optimal) | <120/<80 mmHg |
| Elevated | 120–129 and <80 mmHg |
| Stage 1 Hypertension | 130–139 or 80–89 mmHg |
| Stage 2 Hypertension | ≥140 or ≥90 mmHg |
| Hypertensive Crisis | ≥180 and/or ≥120 mmHg (requires immediate medical attention) |
Important note: A single high reading doesn’t necessarily mean you have hypertension. Healthcare providers usually confirm elevated readings over multiple measurements.
Resting Heart Rate: Your Heart’s Daily Workload
Your resting heart rate is how many times your heart beats in a minute while you are resting.
In adults, having a resting heart rate between 60 and 100 beats per minute is regarded as normal, but physically fit people tend to have lower ones thanks to their more efficient blood circulation.
Many things that happen in everyday life can have a temporary impact on resting heart rate, such as:
- Quality of sleep
- Amount of stress
- Caffeine intake
- Dehydration
- Illness
- Physical fitness
In general, if you got a really high reading after running up the stairs, there is nothing to worry about. But if your resting heart rate is constantly high, it might be a good idea to talk about it with your doctor.
| Category | Resting Heart Rate (beats/minute) |
| Well-conditioned athletes | 40–60 bpm |
| Typical healthy adults | 60–100 bpm |
| May be normal in athletes; otherwise depends on symptoms | Below 60 bpm |
| Tachycardia (should be medically evaluated if persistent) | Above 100 bpm |
Resting heart rate varies with fitness level, stress, medications, illness, and hydration. A lower resting heart rate isn’t always better unless you’re otherwise healthy.
Blood Sugar: Your Body’s Main Energy Source
Glucose is the main source of energy for your body, but it needs help to get into your cells.
Think of glucose as fuel that is waiting outside of your house and insulin as the key that opens the door to your house. When insulin works properly, glucose will get into your cells and provide them with energy.
If this process doesn’t function well, glucose will remain in your bloodstream without being used.
Healthcare providers regularly measure blood sugar levels with:
- Fasting blood glucose
- Results of the HbA1c test that show blood levels of sugar over the previous two to three months
Keeping track of your blood sugar levels is vital not only for people with diabetes. Keeping blood sugar at a healthy level means you will have good energy levels and metabolism, while also protecting yourself from heart disease.
Fasting Glucose
| Category | Measurement (mg/dL) |
| Normal | 70–99 |
| Prediabetes | 100–125 |
| Diabetes | 126+ |
| Low Blood Sugar | <70 |
HbA1c
| Category | HbA1c |
| Normal | <5.7% |
| Prediabetes | 5.7–6.4% |
| Diabetes | ≥6.5% |
Cholesterol: Not All Cholesterol Is the Enemy
The reputation of cholesterol has been negative over time, but the body does require it for the creation of cells and hormones.
It is important to note the method in which cholesterol is transported in the blood.
Some of the health metrics that healthcare professionals use to look at types of cholesterol are :
- LDL cholesterol, which contributes to the deposition of plaque in the arteries when it reaches high levels.
- HDL cholesterol, which gets rid of the excess cholesterol in the blood.
- Triglycerides, which are another type of fat that can increase cardiovascular risks when the levels are raised.
Cholesterol, rather than being seen as either good or bad, should be looked at as a means to maintain equilibrium in terms of balance. Healthy cholesterol levels help in enabling the body to function normally, but an imbalance in the levels for a long time can lead to heart disease.
LDL (Low-Density Lipoprotein)
| Category | LDL (mg/dL) |
| Optimal | Below 100 |
| Near Optimal | 100–129 |
| Borderline High | 130–159 |
| High | 160 or higher |
HDL (High-Density Lipoprotein)
| Category | Men (mg/dL) | Women (mg/dL) |
| Low (higher risk) | <40 | <50 |
| Protective | ≥60 | ≥60 |
Triglycerides
| Category | Triglycerides (mg/dL) |
| Normal | Below 150 |
| Borderline High | 150–199 |
| High | 200–499 |
| Very High | 500 or above |
Body Composition: Looking Beyond the Scale
Weighing scales can help us see what we weigh, but they do not show what this weight is comprised of.
Body weight includes:
- Muscle
- Body fat
- Bone
- Water
- Organs
Because of this, we can see why two people can weigh the same but be completely different when it comes to their health status.
Health professionals will also look at:
- Body Mass Index (BMI) to screen for general health
- Waist circumference to check for fat accumulation in the abdominal region
- Body fat percentage if applicable
Although BMI is useful in population studies, it does not differentiate between fat and muscle, so it should not be used alone when assessing one’s health.
Body Mass Index (BMI)
| Category | BMI |
| Healthy Weight | 18.5–24.9 |
| Overweight | 25–29.9 |
| Obesity | 30 or higher |
| Underweight | Below 18.5 |
BMI is intended as a screening tool, not a direct measure of body fat.
Waist Circumference
| Category | Men | Women |
| Lower Health Risk | Less than 40 in (102 cm) | Less than 35 in (88 cm) |
| Higher Health Risk | 40 in (102 cm) or more | 35 in (88 cm) or more |
BMI is a useful screening tool but doesn’t distinguish between muscle and fat. That’s why waist circumference and overall body composition provide additional context.
Healthy Body Fat %
| Category | Men | Women |
| Essential | 2–5% | 10–13% |
| Healthy | 10–20% | 18–28% |
| Acceptable | 21–24% | 29–31% |
| High | 25%+ | 32%+ |
Oxygen Saturation: Measuring How Well Your Body Uses Oxygen
Inhalation provides oxygen needed for the proper functioning of organs.
Oxygen saturation, or SpO₂, is a measure of the amount of oxygen transported by red blood cells.
Normal measurements of oxygen saturation range from 95% to 100% in healthy individuals.
Even if checking oxygen saturation isn’t necessary for most healthy adults, pulse oximeters are now found in most households and can be useful in respiratory illnesses or when advised by physicians.
| Category | Oxygen Saturation (SpO₂) |
| Normal | 95–100% |
| Mildly Low | 91–94% |
| Low (Hypoxemia) | ≤90% |
Lifestyle Metrics: The Numbers You Can Influence Every Day
Not all vital health indicators can be obtained through blood tests
With modern health technological advancements in recent times, it is now possible to track various behavior as it relates to one’s health.
These measures include the following behavior:
- How long one sleeps
- Physical activity levels
- Time spent exercising daily
- Walking steps
- Duration of sitting
- Stress levels
These behaviors go beyond being statistics about one’s fitness and are essential in determining other medical metrics mentioned earlier.
Why These Health Metrics Are More Connected Than You Think
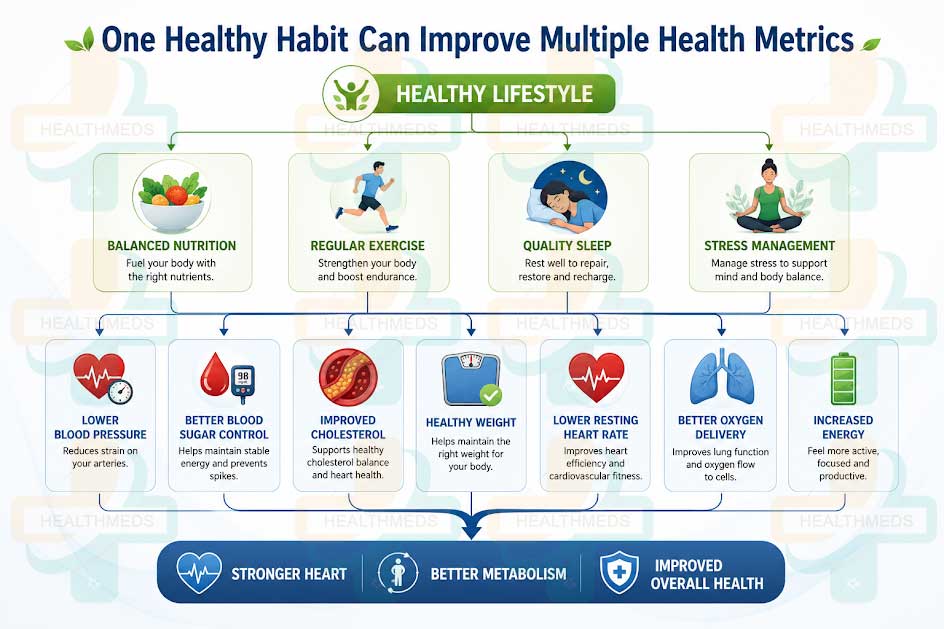 One of the most common misconceptions is that every health metric functions independently.
In actuality, your body is an integrated system.
Take poor sleep, for example.
Sleep deprivation can lead to increased stress hormones in the body.
In turn, high stress hormones can lead to higher heart rates and blood pressure.
Fatigue leads to less physical activity, making it simpler to gain weight.
Less activity may consequently lead to problems in blood sugar regulation and cholesterol levels.
For instance, what started as a problem with sleep could lead to issues with many health metrics.
Conversely, improving sleep quality, eating well, exercising, managing stress, and drinking adequate amounts of water can lead to improvement across different health metrics.
That’s why healthcare professionals encourage healthy habits rather than focusing on one isolated number.
What Can Change Your Health Metrics?
While some elements can be controlled, some cannot.
Many practices can positively change health metrics, including:
- Regular exercise
- Proper nutrition
- Good sleeping practices
- Stress control
- Hydration
- No smoking
- No excessive drinking
However, it is important to note that genetics, age, diseases, and drugs can also influence these measurements. Therefore, knowing your family lineage and making proves the routine check ups makes prevention health care effective.
Don’t Chase After Perfect Numbers Instead Look for Healthy Trends
Having high blood pressure just once does not suggest that you now have hypertension.
A single sleepless night does not count against the several months of sleep you might have achieved.
Missing one workout session does not lead to losing all your previous fitness achievements.
Health measurements fluctuate from one day to the next. Things such as fluids, illnesses, anxiety, physical activity, and even the hour affect such measurements at least to some degree.
Both healthcare professionals and common people are usually interested in seeing a trend in the readings rather than reading individual measurements.
By checking your readings from time to time, you can see ongoing changes in your condition and developments that require you to visit a healthcare provider.
The Best Health Metric Is the One That Inspires Better Habits
Health indicators are not meant to be compared or feared. They are simply instruments that help you comprehend your body’s reaction to your day-to-day actions.
Blood pressure, blood sugar level, cholesterol level, heart rate, quality of sleep, and physical activity each represent a piece of your health puzzle. No single parameter gives a complete picture, but taken together they provide insights about how well your body functions.
The most important lesson to learn is not achieving certain parameters, but rather dealing with the habits that can work on improving them over time.
For instance, a person can benefit from healthy eating, a regular active lifestyle, proper sleeping routines, effective stress management, and regular medical checkups.
The feedback coming from your body is always there. Knowing how to interpret this feedback is one of the soundest investments in your health. Living longer is not enough; everyone deserves to live better.